
July 5th Was Weirdly Empty at Disney World – And the Data Proves It
According to MouseQueue data, July 5th was the lowest-wait day in the previous 15-day window. Park-wide average waits were about 30% lower than normal, and some Lightning Lanes that usually disappear faster than a churro in front of a toddler were still available well into the afternoon.
That is not normal summer behavior.
Usually, early July at Disney World feels like the surface of the sun with strollers. But July 5th gave guests a rare gift: lower waits, easier Lightning Lane availability, and a day that actually felt manageable.
The Big Number
Across Walt Disney World, the average posted wait dropped from 22.4 minutes over the previous 14 days to just 15.7 minutes on the 5th. That is a 30% drop. Even better, the busiest ride of the day never broke 95 minutes. In the two weeks before July 5th, the top ride of the day usually peaked somewhere between 105 and 170 minutes. In other words, the parks were not empty-empty. This was still Disney World, not your local abandoned mall. But compared to the days around it, the 5th was noticeably lighter.
Which Park Dropped the Most?
Hollywood Studios had the biggest drop, falling from a normal average wait of 25 minutes to just 16 minutes. That is a 36% decrease, which is basically Hollywood Studios saying, “Fine, I’ll be reasonable today.” Magic Kingdom was close behind, dropping 31%, while Animal Kingdom fell 27% and EPCOT dropped 23%.
Here’s how it looked:
| Park | Normal Avg Wait | July 5th Avg Wait | Drop |
|---|---|---|---|
| Hollywood Studios | 25.0 min | 16.0 min | -36% |
| Magic Kingdom | 23.0 min | 15.8 min | -31% |
| Animal Kingdom | 13.6 min | 9.9 min | -27% |
| EPCOT | 27.4 min | 21.0 min | -23% |
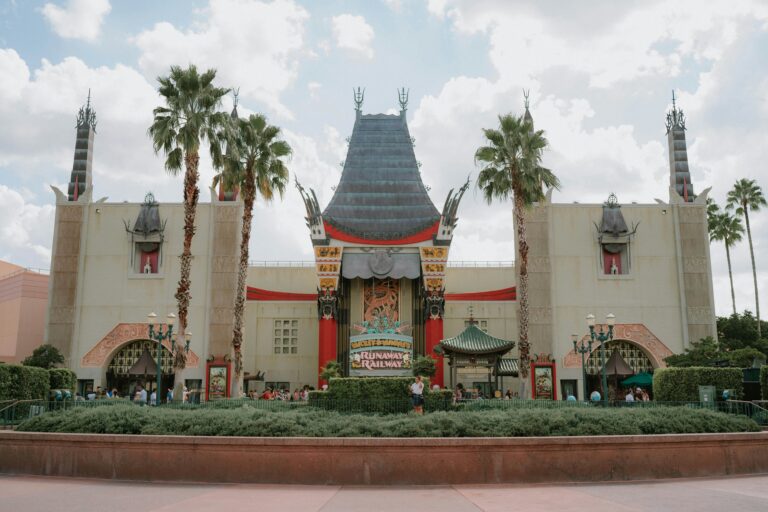
Hollywood Studios being the biggest drop matters because that park can get rough fast. Between Slinky Dog Dash, Rise of the Resistance, Tower of Terror, and Mickey & Minnie’s Runaway Railway, it usually does not take much for waits to start looking like a car payment.
Headliners Were Still Headliners… Just Less Annoying
The major rides were still the longest waits in the parks, but they were much more manageable than normal.
Some of the biggest examples:
| Ride | Normal Avg Wait | July 5th Avg Wait |
|---|---|---|
| Test Track | 73 min | 67 min |
| Guardians: Cosmic Rewind | 72 min | 59 min |
| Slinky Dog Dash | 70 min | 55 min |
| TRON Lightcycle / Run | 60 min | 45 min |
| Avatar Flight of Passage | 55 min | 43 min |
| Seven Dwarfs Mine Train | 50 min | 38 min |
| Rise of the Resistance | 46 min | 30 min |
| Tiana’s Bayou Adventure | 41 min | 22 min |
| Tower of Terror | 36 min | 17 min |
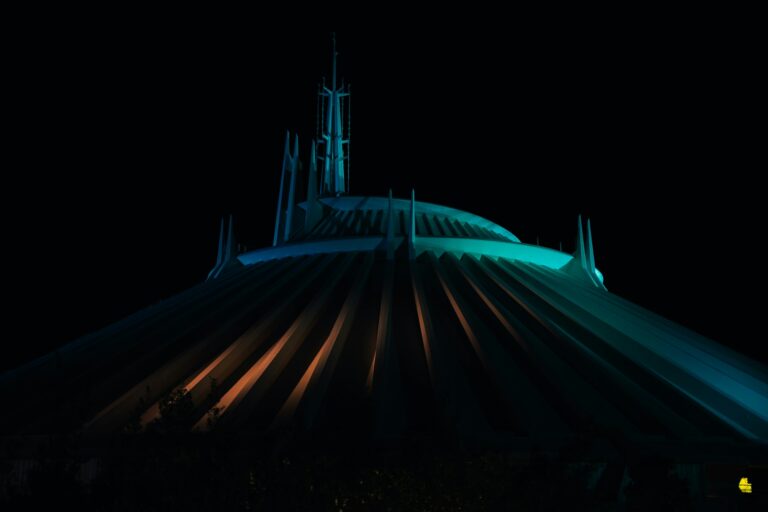
| Space Mountain | 37 min | 20 min |
The biggest eye-catchers here are Rise of the Resistance at 30 minutes, Tiana’s Bayou Adventure at 22 minutes, and Tower of Terror at 17 minutes. Those are not “summer at Disney World” numbers. Those are “did we accidentally walk into a private event?” numbers.
The Real Story: Lightning Lanes Stayed Available
The wait times were nice. The Lightning Lane availability was the real story. Several rides that normally sell before the park day or early that morning stayed available for hours. Some never sold out at all.
| Ride | Typical Sellout | July 5 |
|---|---|---|
| Seven Dwarfs Mine Train | 2 days early | Never sold out |
| Rise of the Resistance | 2 days early | Never sold out |
| Tower of Terror | Around 11:00 a.m. | Never sold out |
| Space Mountain | Around 5:00 p.m. | Never sold out |
| Avatar Flight of Passage | 9:13 a.m. | 5:31 p.m. |
| Tiana’s Bayou Adventure | 12:09 p.m. | 5:30 p.m. |
| Test Track | 2 days early | 10:00 a.m. |
| Slinky Dog Dash | 2 days early | 9:30 a.m. |
| Guardians: Cosmic Rewind | 2 days early | 9:05 a.m. |
On a normal day, Seven Dwarfs Mine Train’s Lightning Lane is gone before most guests finish their coffee, 2 days ago. On July 5th, you could have booked it after lunch. That is wild. For anyone who has ever refreshed the app at 7:00 a.m. like they are defusing a bomb, this was a rare easy-mode day.
The Morning Was Almost Too Good
The hourly data also shows that July 5 did not just peak lower. It stayed calmer throughout the day. The 8–9 a.m. window averaged just 10.5 minutes across the parks.
| Time | Normal Avg Wait | July 5th Avg Wait |
|---|---|---|
| 8 a.m. | 15.2 min | 10.5 min |
| 11 a.m. | 28.2 min | 19.4 min |
| 12 p.m. | 28.5 min | 18.7 min |
| 4 p.m. | 25.3 min | 17.2 min |
| 9 p.m. | 18.5 min | 11.9 min |
The midday spike was also softer than normal. Instead of waits climbing hard and staying there, July 5 stayed surprisingly flat.
So Why Was July 5th So Slow?
The most likely reason is the post-Fourth-of-July drop-off. July 4th had already started showing signs of softer crowds, with fewer rides selling out than expected. Then July 5th landed on the travel-home side of the holiday weekend.
A lot of families likely came in for the Fourth, did the fireworks, battled the crowds, sweated through their patriotic Mickey shirts, and then headed home before the next summer wave rolled in. That created a weird little pocket of lower demand. And for the guests who were still there? They got a very nice day.
What This Means for Disney Planning
This is exactly why MouseQueue watches the data.
Crowd calendars are helpful, but real-time attraction and Lightning Lane behavior tells the better story. July 5th was not just “a little lighter.” It was meaningfully different across wait times, headliner rides, and Lightning Lane availability.
The takeaway is not that every July 5th will be empty forever. Disney does not work like that. If it did, planning would be easy and I would have to find a new hobby, like relaxing. Gross. The real takeaway is this: Holiday weekends can create weird crowd patterns, especially right after the main event is over.
Sometimes the day after the chaos is where the opportunity is. And on July 5, 2026, that opportunity was huge. Lower waits. Better Lightning Lane availability. Headliners staying bookable longer than normal. A rare Disney summer day where the data basically said: “Go ahead. Ride something. You might actually enjoy yourself.”